


 Agency (White Label)Getting StartedConfiguring TrafftBooking WebsiteCustom FeaturesIntegrations
 Admin Views
When you first log in to your Trafft account as an “Admin,” you’ll be directed to the “Dashboard” page. This view provides a snapshot of your current and previous appointments, employee details, revenue data, and services overview, all in one convenient location.
The dashboard is organized into seven main sections, each offering distinct information and insights.
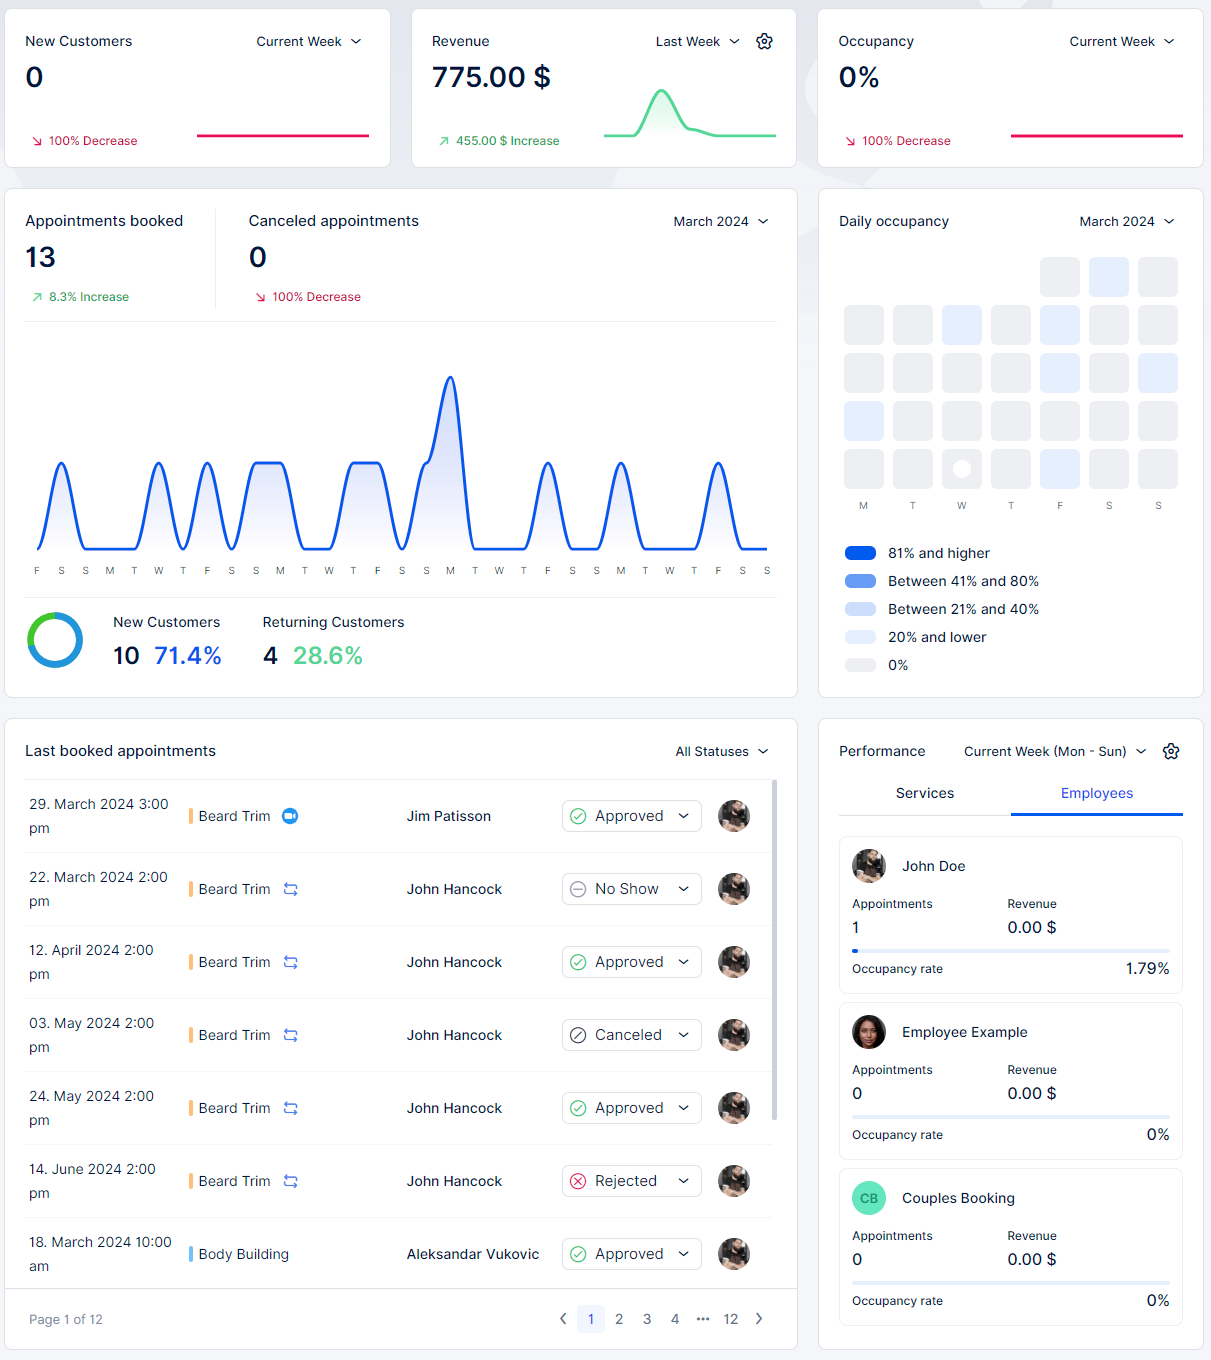
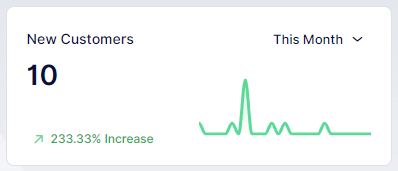
New Customers
In the “New customers” section, you’ll find the count of new customers who have booked appointments within the selected time frame from the period picker dropdown. Time frames available in the period picker include Current week, Last week, This month, Last month, Last three months, Last six months, Last Twelve Months, and Last Year. You’ll also find a graphical representation illustrating the change in the number of new customers over time.
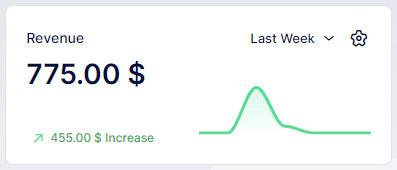
Revenue
In the “Revenue” section, you’ll find the total income received within the selected time frame from the period picker. Clicking on the gear symbol, you have the option to view the total from paid transactions, pending payments, or both combined. Additionally, a graph illustrates the change in revenue over the chosen period.
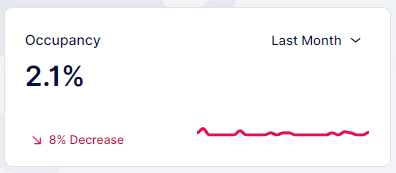
Occupancy
In the “Occupancy” section, you’ll find the percentage of occupancy, calculated as a ratio of each employee’s total working hours to the hours booked through appointments for that employee. You can select the period for which you want to view the occupancy rate and also access a graph view, similar to the previous sections.
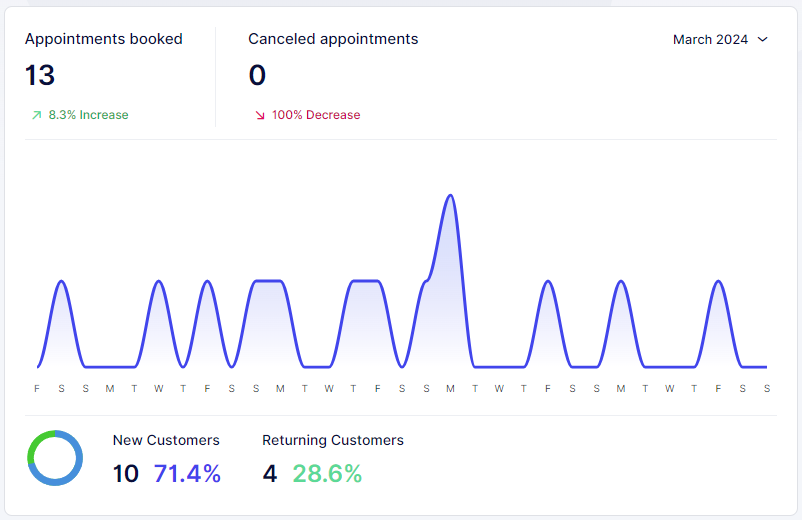
Appointments overview
In the “Appointments” section, you can monitor the number of appointments for the current year or since you registered with Trafft. This section displays the total number of appointments, along with the percentage increase (green) or decrease (red) compared to the previous period. Similarly, it provides statistics on the number of canceled appointments. At the bottom of the graph, you’ll find user-related data, such as the count of new versus recurring users and the percentage they each contribute to the total number of users who booked appointments in the selected timeframe.
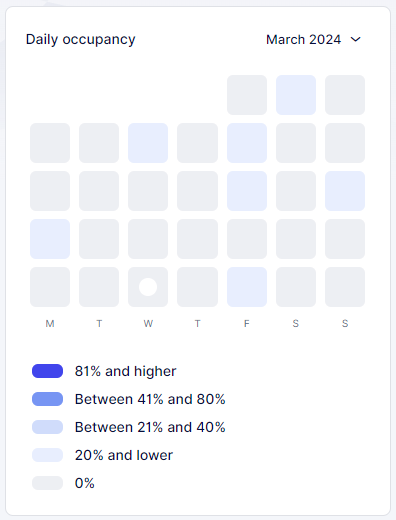
Daily occupancy
In the “Daily Occupancy” section, you can track the occupancy rate for each day of the month. Similar to the total occupancy, it calculates the number of hours booked for appointments divided by the total number of working hours for all employees on that specific day. Various occupancy rates are represented by different shades, and a scale explains which shade corresponds to which percentage. Clicking on any day in this section will display the exact occupancy rate for that specific day.
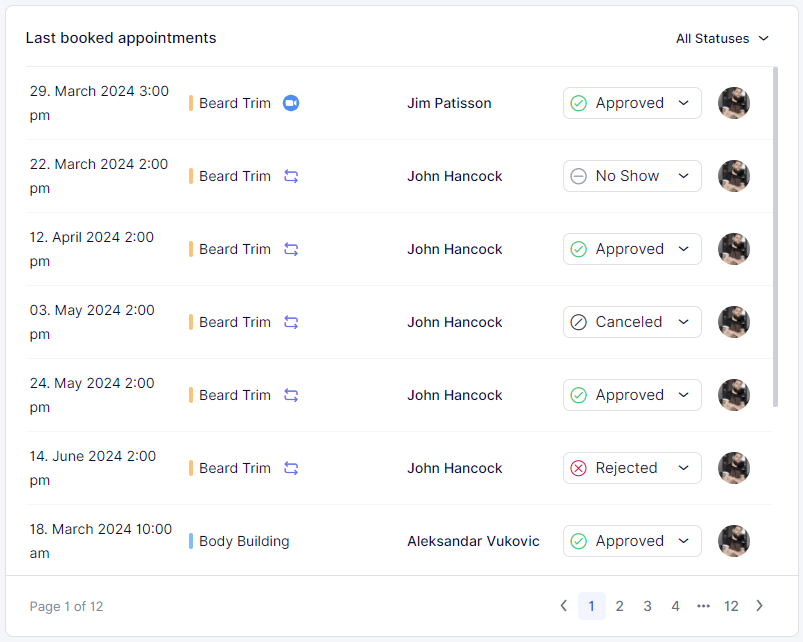
Last Booked Appointments
In the “Last Booked Appointments” section, you’ll find a comprehensive list of all appointments, displaying essential details for each appointment such as date & time, service, employee, and customer. The list is organized with the latest booked appointment appearing at the top and descending to the earliest appointment at the bottom. You can filter the appointments shown in the list by their status, allowing you to view approved, pending, canceled, rejected, no-show, or all appointments.
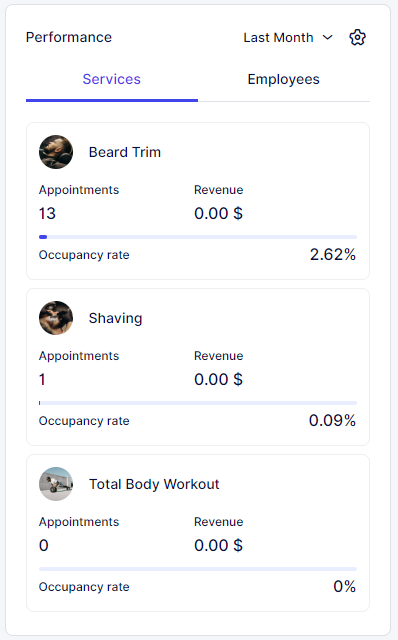
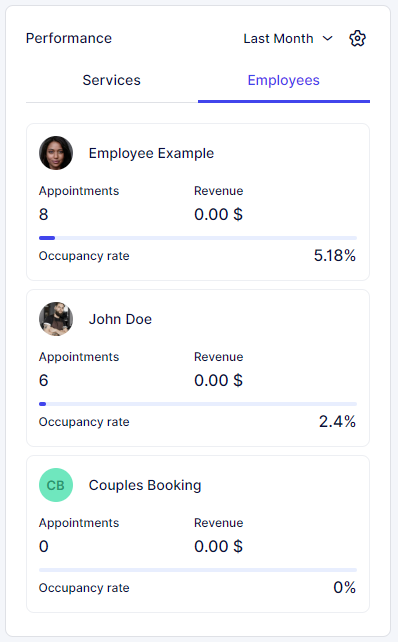
Performance
The “Performance” section features tabs for “Employees” and “Services”. In both tabs, you’ll find the top three employees or services with the highest or lowest occupancy rates, based on your sorting preference (most or least occupied). For each employee or service, you can view their occupancy rate, the number of appointments, and the revenue they’ve generated. This data is specific to the selected period from the period picker at the top right of the section.
Have more questions?
If you face an issue, and cannot find an answer in the documentation, feel free to submit a support ticket!